This page describes how to use Vertex AI Model Monitoring with Vertex Explainable AI to detect skew and drift for the feature attributions of categorical and numerical input features.
Overview of feature attribution-based monitoring
Feature attributions indicate how much each feature in your model contributed to the predictions for each given instance. When you request predictions, you get predicted values as appropriate for your model. When you request explanations, you get the predictions along with feature attribution information.
Attribution scores are proportional to the contribution of the feature to a model's prediction. They are typically signed, indicating whether a feature helps push the prediction up or down. Attributions across all features must add up to the model's prediction score.
By monitoring feature attributions, Model Monitoring tracks changes in a feature's contributions to a model's predictions over time. A change in a key feature's attribution score often signals that the feature has changed in a way that can impact the accuracy of the model's predictions.
For information on how a feature attribution score is calculated, see Feature attribution methods.
Feature attribution training-serving skew and prediction drift
When you create a monitoring job for a model with Vertex Explainable AI enabled, Model Monitoring monitors skew or drift for both feature distributions and feature attributions. For information on feature distribution skew and drift, see Introduction to Vertex AI Model Monitoring.
For feature attributions:
Training-serving skew occurs when a feature's attribution score in production deviates from the feature's attribution score in the original training data.
Prediction drift occurs when a feature's attribution score in production changes significantly over time.
You can enable skew detection if you provide the original training dataset for your model; otherwise, you should enable drift detection. You can also enable both skew and drift detection.
Prerequisites
To use Model Monitoring with Vertex Explainable AI, complete the following:
If you are enabling skew detection, upload your training data or output of a batch explanation job for your training dataset to Cloud Storage or BigQuery. Obtain the URI link to the data. For drift detection, training data or explanation baseline isn't required.
Have an available model in Vertex AI that is either a tabular AutoML or imported tabular custom training type:
An AutoML tabular model has Vertex Explainable AI automatically configured, so you can skip to enabling skew or drift detection. Note that only classification and regression models are supported.
An imported custom-trained model must be configured for Vertex Explainable AI when you create, import, or deploy the model.
Configure your model to use Vertex Explainable AI when you create, import, or deploy the model. The
ExplanationSpec.ExplanationParametersfield must be populated for your model.Optional: For custom-trained models, upload the analysis instance schema for your model to Cloud Storage. Model Monitoring requires the schema to begin the monitoring process and calculate the baseline distribution for skew detection. If you don't provide the schema during job creation, the job remains in a pending state until Model Monitoring can automatically parse the schema from the first 1000 prediction requests the model receives.
Enable skew or drift detection
To set up either skew detection or drift detection, create a model deployment monitoring job:
Console
To create a model deployment monitoring job using the Google Cloud console, create an endpoint:
In the Google Cloud console, go to the Vertex AI Endpoints page.
Click Create Endpoint.
In the New endpoint pane, name your endpoint and set a region.
Click Continue.
In the Model name field, select an imported custom training or tabular AutoML model.
In the Version field, select a version for your model.
Click Continue.
In the Model monitoring pane, make sure Enable model monitoring for this endpoint is toggled on. Any monitoring settings you configure apply to all models deployed to the endpoint.
Enter a Monitoring job display name.
Enter a Monitoring window length.
For Notification emails, enter one or more comma-separated email addresses to receive alerts when a model exceeds an alerting threshold.
(Optional) For Notification channels, select Cloud Monitoring channels to receive alerts when a model exceeds an alerting threshold. You can select existing Cloud Monitoring channels or create a new one by clicking Manage notification channels. The Console supports PagerDuty, Slack, and Pub/Sub notification channels.
Enter a Sampling rate.
Optional: Enter the Prediction input schema and Analysis input schema.
Click Continue. The Monitoring objective pane opens, with options for skew or drift detection:
Skew detection
- Select Training-serving skew detection.
- Under Training data source, provide a training data source.
- Under Target column, enter the column name from the training data that the model is trained to predict. This field is excluded from the monitoring analysis.
- Optional: Under Alert thresholds, specify thresholds at which to trigger alerts. For information about how to format the thresholds, hold the pointer over the Help icon.
- Click Create.
Drift detection
- Select Prediction drift detection.
- Optional: Under Alert thresholds, specify thresholds at which to trigger alerts. For information about how to format the thresholds, hold the pointer over the Help icon.
- Click Create.
gcloud
To create a model deployment monitoring job using the gcloud CLI, first deploy your model to an endpoint.
A monitoring job configuration applies to all deployed models under an endpoint.
Run the gcloud ai model-monitoring-jobs create command:
gcloud ai model-monitoring-jobs create \
  --project=PROJECT_ID \
  --region=REGION \
  --display-name=MONITORING_JOB_NAME \
  --emails=EMAIL_ADDRESS_1,EMAIL_ADDRESS_2 \
  --endpoint=ENDPOINT_ID \
  --feature-thresholds=FEATURE_1=THRESHOLD_1,FEATURE_2=THRESHOLD_2 \
  --prediction-sampling-rate=SAMPLING_RATE \
  --monitoring-frequency=MONITORING_FREQUENCY \
  --target-field=TARGET_FIELD \
  --bigquery-uri=BIGQUERY_URI
where:
PROJECT_ID is the ID of your Google Cloud project. For example,
my-project.REGION is the location for your monitoring job. For example,
us-central1.MONITORING_JOB_NAME is the name of your monitoring job. For example,
my-job.EMAIL_ADDRESS is the email address where you want to receive alerts from Model Monitoring. For example,
[email protected].ENDPOINT_ID is the ID of the endpoint under which your model is deployed. For example,
1234567890987654321.Optional: FEATURE_1=THRESHOLD_1 is the alerting threshold for each feature you want to monitor. For example, if you specify
Age=0.4, Model Monitoring logs an alert when the [statistical distance][stat-distance] between the input and baseline distributions for theAgefeature exceeds 0.4.Optional: SAMPLING_RATE is the fraction of the incoming prediction requests you want to log. For example,
0.5. If not specified, Model Monitoring logs all prediction requests.Optional: MONITORING_FREQUENCY is the frequency at which you want the monitoring job to run on recently logged inputs. The minimum granularity is 1 hour. The default is 24 hours. For example,
2.(required only for skew detection) TARGET_FIELD is the field that is being predicted by the model. This field is excluded from the monitoring analysis. For example,
housing-price.(required only for skew detection) BIGQUERY_URI is the link to the training dataset stored in BigQuery, using the following format:
bq://\PROJECT.\DATASET.\TABLE
For example,
bq://\my-project.\housing-data.\san-francisco.You can replace the
bigquery-uriflag with alternative links to your training dataset:For a CSV file stored in a Cloud Storage bucket, use
--data-format=csv --gcs-uris=gs://BUCKET_NAME/OBJECT_NAME.For a TFRecord file stored in a Cloud Storage bucket, use
--data-format=tf-record --gcs-uris=gs://BUCKET_NAME/OBJECT_NAME.For a [tabular AutoML managed dataset][dataset-id], use
--dataset=DATASET_ID.
Python SDK
For information about the full end-to-end Model Monitoring API workflow, see the example notebook.
REST API
If you haven't done so already, deploy your model to an endpoint.
Retrieve the deployed model ID for your model by getting the endpoint information. Note the DEPLOYED_MODEL_ID, which is the
deployedModels.idvalue in the response.Create a model monitoring job request. The instructions below show how to create a basic monitoring job for drift detection with attributions. For skew detection, add the
explanationBaselineobject to theexplanationConfigfield in the request JSON body and provide one of the following:The output of a batch explanation job for your training dataset.
A
TrainingDataseton which the service runs aBatchExplainjob to generate a baseline.
For more details, see the Monitoring job reference.
Before using any of the request data, make the following replacements:
- PROJECT_ID: is the ID of your Google Cloud project. For
example,
my-project. - LOCATION: is the location for your monitoring job. For example,
us-central1. - MONITORING_JOB_NAME: is the name of your monitoring job. For
example,
my-job. - PROJECT_NUMBER: is the number for your Google Cloud project. For
example,
1234567890. - ENDPOINT_ID is the ID for the endpoint to which your model is deployed. For
example,
1234567890. - DEPLOYED_MODEL_ID: is the ID for the deployed model.
- FEATURE:VALUE is the alerting threshold
for each feature you want to monitor. For example,
"housing-latitude": {"value": 0.4}. An alert is logged when the statistical distance between the input feature distribution and its corresponding baseline exceeds the specified threshold. By default, every categorical and numerical feature is monitored, with threshold values of 0.3. - EMAIL_ADDRESS: is the email address where you want to receive
alerts from Model Monitoring. For example,
[email protected]. - NOTIFICATION_CHANNELS:
a list of
Cloud Monitoring notification channels
where you want to receive alerts from Model Monitoring. Use the resource names
for the notification channels, which you can retrieve by
listing the notification channels
in your project. For example,
"projects/my-project/notificationChannels/1355376463305411567",
       "projects/my-project/notificationChannels/1355376463305411568"
.
Request JSON body:
{
  "displayName":"MONITORING_JOB_NAME",
  "endpoint":"projects/PROJECT_NUMBER/locations/LOCATION/endpoints/ENDPOINT_ID",
  "modelDeploymentMonitoringObjectiveConfigs": {
     "deployedModelId": "DEPLOYED_MODEL_ID",
     "objectiveConfig":  {
        "predictionDriftDetectionConfig": {
            "driftThresholds": {
              "FEATURE_1": {
                "value": VALUE_1
               },
              "FEATURE_2": {
                "value": VALUE_2
               }
            }
         },
        "explanationConfig": {
            "enableFeatureAttributes": true
        }
      }
  },
  "loggingSamplingStrategy": {
     "randomSampleConfig":  {
        "sampleRate":  0.5,
     },
  },
  "modelDeploymentMonitoringScheduleConfig": {
     "monitorInterval": {
        "seconds": 3600,
     },
  },
  "modelMonitoringAlertConfig": {
     "emailAlertConfig": {
        "userEmails": ["EMAIL_ADDRESS"],
     },
     "notificationChannels": [NOTIFICATION_CHANNELS]
  }
}
To send your request, expand one of these options:
You should receive a JSON response similar to the following:
{
  "name": "projects/PROJECT_NUMBER/locations/LOCATION/modelDeploymentMonitoringJobs/MONITORING_JOB_NUMBER",
  ...
  "state": "JOB_STATE_PENDING",
  "scheduleState": "OFFLINE",
  ...
  "bigqueryTables": [
    {
      "logSource": "SERVING",
      "logType": "PREDICT",
      "bigqueryTablePath": "bq://PROJECT_ID.model_deployment_monitoring_8451189418714202112.serving_predict"
    }
  ],
  ...
}
Once the monitoring job is created, Model Monitoring logs
incoming prediction requests in a generated BigQuery table named
PROJECT_ID.model_deployment_monitoring_ENDPOINT_ID.serving_predict.
If request-response logging is enabled,
Model Monitoring logs incoming requests in the same
BigQuery table that is used for request-response logging.
See Using Model Monitoring for instructions on how to do the following optional tasks:
Update a Model Monitoring job.
Configure alerts for the Model Monitoring job
Configure alerts for anomalies.
Analyze feature attribution skew and drift data
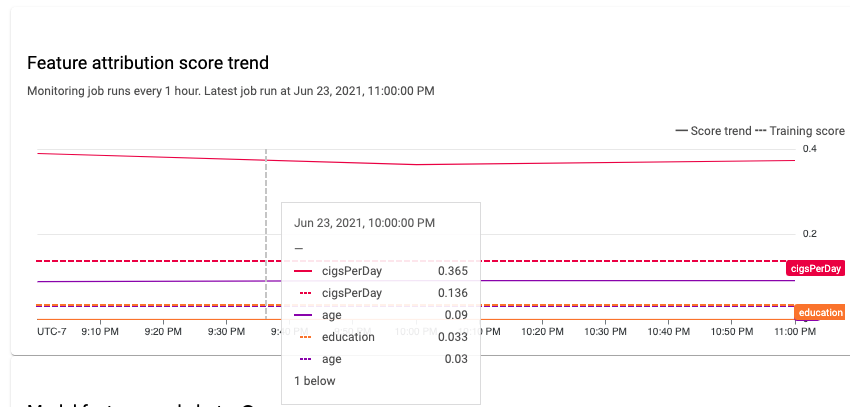
You can use the Google Cloud console to visualize the feature attributions of each monitored feature and learn which changes led to skew or drift. For information about analyzing feature distribution data, see Analyze skew and drift data.
In a stable machine learning system, features' relative importance generally remains relatively stable over time. If an important feature drops in importance, it might signal that something about that feature has changed. Common causes of feature importance drift or skew include the following:
- Data source changes.
- Data schema and logging changes.
- Changes in end-user mix or behavior (for example, due to seasonal changes or outlier events).
- Upstream changes in features generated by another machine learning model.
Some examples are:
- Model updates that cause an increase or decrease in coverage (overall or for an individual classification value).
- A change in performance of the model (which changes the meaning of the feature).
- Updates to the data pipeline, which can cause a decrease in overall coverage.
In addition, consider the following when analyzing feature attribution skew and drift data:
Track the most important features. A large change in attribution to a feature means that the feature's contribution to the prediction has changed. Because the prediction score is equal to the sum of the feature contributions, large attribution drift of the most important features usually indicates large drift in the model predictions.
Monitor all feature representations. Feature attributions are always numeric, regardless of the underlying feature type. Due to their additive nature, attributions to a multi-dimensional feature such as embeddings can be reduced to a single numeric value by adding up the attributions across dimensions. This lets you use standard univariate drift detection methods for all feature types.
Account for feature interactions. Attribution to a feature accounts for the feature's contribution to the prediction, both individually and by its interactions with other features. If a feature's interactions with other features changes, distributions of attributions to a feature change, even if the marginal distribution of the feature remains the same.
Monitor feature groups. Because attributions are additive, you can add up attributions to related features to obtain the attribution of a feature group. For example, in a credit lending model, combine the attribution to all features related to the loan type (for example, "grade", "sub_grade", "purpose") to obtain a single loan attribution. This group-level attribution can then be tracked to monitor for changes in the feature group.
What's next
- Work with Model Monitoring following the API docs.
- Work with Model Monitoring following the gcloud CLI docs.
- Try the example notebook in Colab or view it on GitHub.
- Learn how Model Monitoring calculates training-serving skew and prediction drift.